

Organizations and individuals alike are continually looking for ways to make sense of massive amounts of information in today’s data-driven environment. Data visualization and analysis have become potent tools for revealing hidden patterns, trends, and insights in large, complicated data sets. Data analysis and visualization offer a holistic method to comprehending data and facilitating informed decision-making by fusing the knowledge of data analysts with the visual depiction of information. We will examine the importance of data analysis and visualization and how they are revolutionizing different businesses in this blog article.
Data analysis involves the process of inspecting, transforming, and modeling data to uncover meaningful patterns, relationships, and trends. It enables organizations to extract valuable insights from data and make informed decisions based on evidence rather than intuition alone. Through statistical techniques, machine learning algorithms, and exploratory data analysis, data analysts can identify correlations, anomalies, and predictive patterns. By leveraging these insights, businesses can optimize processes, identify opportunities, mitigate risks, and enhance overall performance.
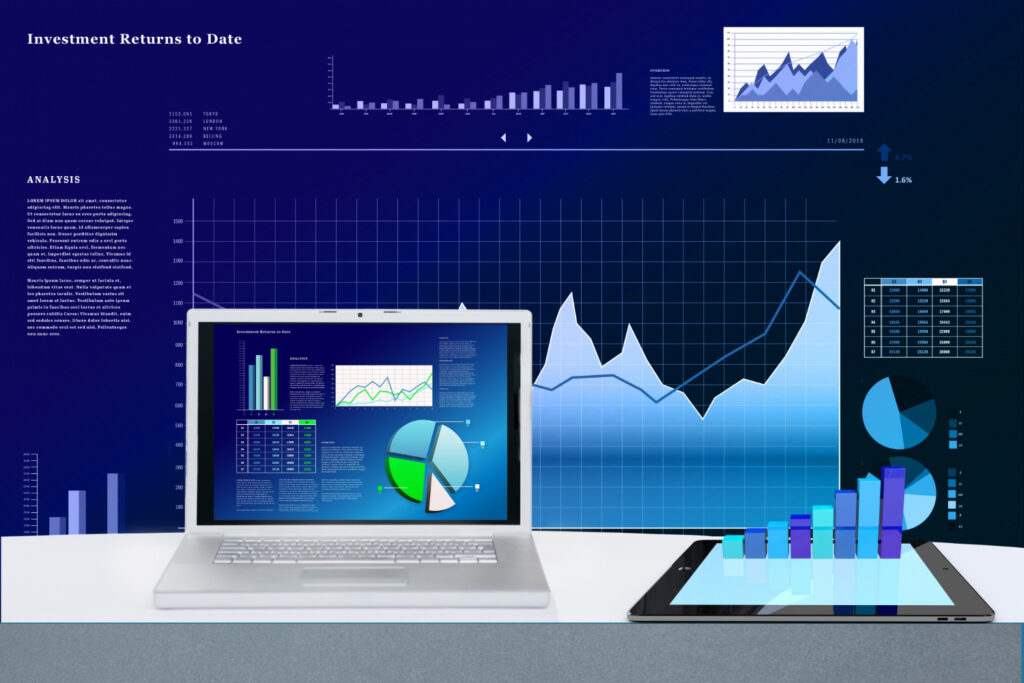
The Role of Visualization
While data analysis provides the foundation for extracting insights, data visualization complements this process by transforming complex data into visually compelling representations. Visualization techniques employ graphs, charts, maps, and interactive dashboards to present information in a manner that is intuitive, accessible, and easily interpretable. By visually representing data, patterns and trends become more apparent, enabling stakeholders to grasp complex information quickly and make data-driven decisions effectively. Visualizations provide a powerful means of communication, allowing individuals across different backgrounds to understand and collaborate on data-driven insights.
Benefits and Applications
- Decision-making: Data analysis and visualization enable organizations to make evidence-based decisions by providing a clear and concise representation of complex data. Executives can identify trends, track key performance indicators, and uncover actionable insights to drive strategic initiatives.
- Business Intelligence: Data analysis and visualization play a vital role in business intelligence by extracting meaningful insights from diverse data sources. With interactive dashboards and real-time reporting, stakeholders can monitor metrics, identify bottlenecks, and optimize processes for improved operational efficiency.
- Customer Analytics: Understanding customer behavior and preferences is crucial for businesses. Data analysis and visualization allow organizations to gain insights into customer demographics, purchasing patterns, and sentiment analysis. This information helps optimize marketing strategies, enhance customer experiences, and drive customer retention and loyalty.
- Financial Analysis: Data analysis and visualization empower financial professionals to analyze market trends, assess risks, and optimize investment strategies. Visualizing financial data allows for easier identification of patterns, anomalies, and opportunities, aiding in portfolio management and financial decision-making.
- Healthcare and Research: Data analysis and visualization are transforming healthcare and scientific research. By analyzing patient data, researchers can identify disease patterns, evaluate treatment effectiveness, and improve healthcare outcomes. Visualizations help in communicating complex medical data, enabling more informed decisions by medical professionals.
Moreover, data analysis and visualization also facilitate storytelling with data. By crafting compelling narratives through visual representations, data analysts can effectively communicate their findings to a wide range of audiences. This storytelling approach helps in conveying the significance of data-driven insights, making them more relatable and memorable. Whether it’s presenting sales trends to stakeholders, illustrating the impact of climate change through interactive maps, or showcasing the progress of a research project, data visualization adds a human touch to the data, enhancing its impact and fostering engagement.
Furthermore, data analysis and visualization are at the forefront of data-driven innovation. With advancements in technology and the availability of big data, organizations have access to vast amounts of information. However, this wealth of data is only valuable if it can be effectively analyzed and understood. Data analysis and visualization techniques are continuously evolving, with new tools, algorithms, and interactive platforms being developed to enhance the process. From advanced machine learning algorithms to immersive virtual reality visualizations, the possibilities are expanding, enabling deeper insights and more impactful storytelling.
In today’s data-centric environment, data analysis and visualization are essential. A potent combination that encourages innovation across a variety of businesses is the capacity to analyze large, complicated data sets, unearth insights, and visually communicate them. Investment in data analysis skills and the use of visualization tools will be crucial for staying competitive and realizing the full potential of data-driven insights as organizations and individuals continue to embrace the potential of data. By utilizing the strength of data analysis and visualization, we may uncover the untold stories that lie inside the data, make wise judgments, and open up fresh doors for development and success.